Metered tokens → verified outcomes → post-trained models
Anyone can rent the same model. Only you have your outcomes.
Arcline meters every AI task in the harness your team already uses and labels it shipped, rejected, or unresolved. That record cuts waste this quarter — then becomes the training data for models that get permanently better at your work, and that no competitor can buy.
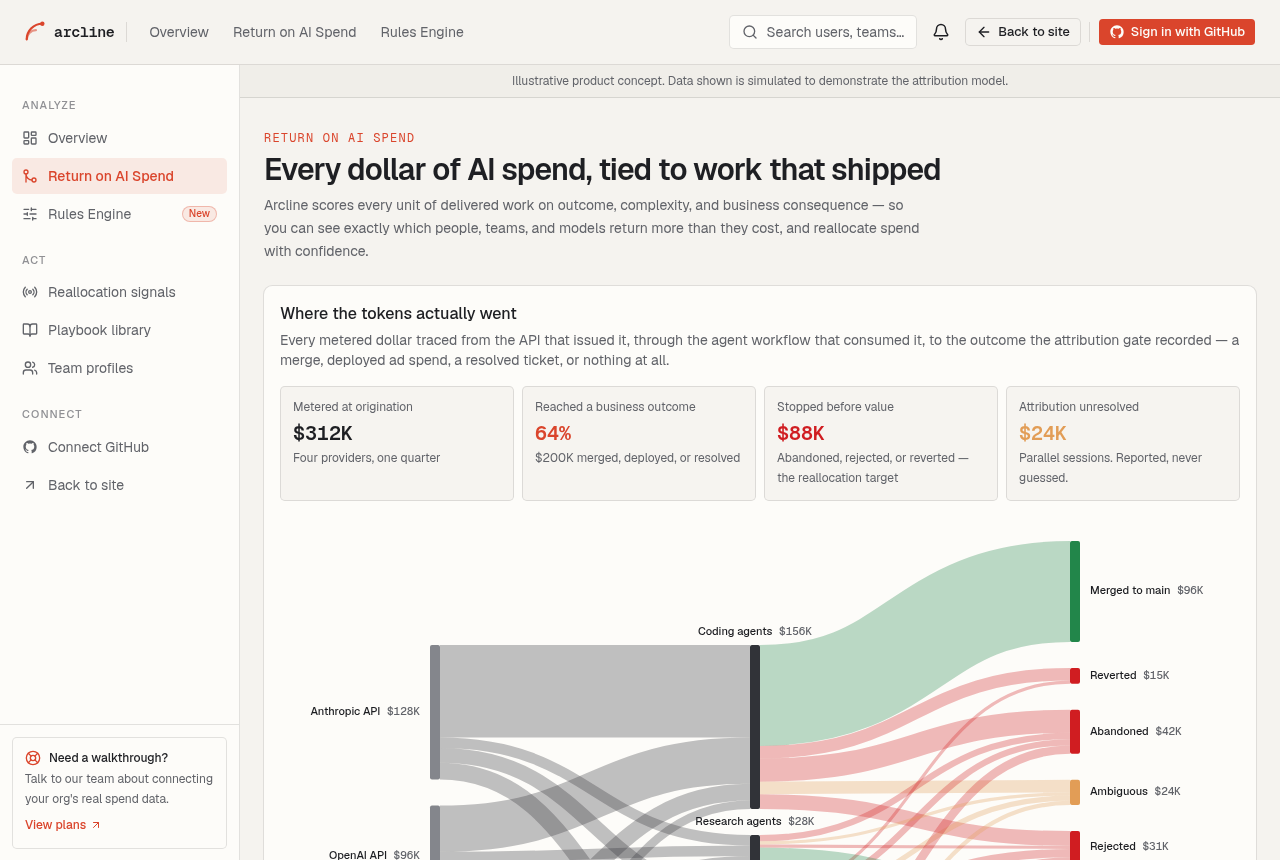
Actual product interface. Figures shown are sample data.
Reference model — illustrative, not customer results
125x
Modeled return on the token line item
top-decile engineer scenario
$40K→$5M
Modeled spend to attributed value
reference SWE profile
3.2x
Modeled organizational lift
pattern-replication scenario
The problem
You can see the invoice. You cannot see the value.
Finance tools stop at the transaction. Nobody can tell you which spend produced shipped work — so budget pressure lands hardest on your highest-ROI users.
The efficiency illusion
Low token spend is not efficiency. It is usually underperformance wearing a smaller invoice.
Team A: $8K/yr, 2 features/qtr. Team B: $22K/yr, 9 features/qtr.
The talent inversion
Spend caps punish your best AI-native engineers first. They leave for companies that measure what they produce.
High performers self-select out of constrained environments.
The replication gap
Your most effective operators are isolated cells. You pay for their tokens and never harvest their method.
Local knowledge never transfers across the org.
· The platform ·
Meter it. Allocate it. Distill it.
Three phases, in order. Each one produces the asset the next one needs — which is why the metering product is the only credible path to the training data.
· Meter·
Live nowSee every token, priced and tied to an outcome.
Produces
The attributed-outcome record
Ingest without instrumentation. One connector per provider and gateway. No per-team SDK rollout, no code changes.
Resolve people, not API keys. Spend lands on a person and a workflow instead of a shared service account.
Label the outcome. Every session resolves to shipped, rejected, or unresolved against merges, tickets, and CRM events — never self-reported.
· Allocate·
NextThe engine stops advising and starts acting.
Produces
The intervention ledger
Route to the cheapest model that still ships. Per-workflow routing tuned on measured outcomes, not public benchmark scores.
Run every change as an experiment. Policies ship against a held-out baseline, so a saving is a measurement instead of a hope.
Retire what stops earning. Failing configs get pulled automatically, with the ledger to justify the call.
· Distill·
The endgameThe record becomes weights.
Produces
Outcome-verified training corpora
Curate outcome-verified corpora. Only sessions with a confirmed positive outcome graduate into training data.
Supply the post-training stack. Trainers have compute and environments. What they lack is verified reward signal from real businesses — that is what we produce.
Bend the spend curve permanently. Efficiency moves into the weights, and the same task completes in a fraction of the tokens.
· The demo ·
It is running. Go click on it.
Phase one is live software, not a mockup. Below is the loop it closes — every image is a capture of the running app, and every step links straight into it. Figures are simulated to demonstrate the attribution model.
Meter
Start with one number you can defend.
Return on AI spend, with attributed value and the spend trend beside it. Every figure drills through to the sessions underneath, so the headline is auditable rather than asserted.
Open this view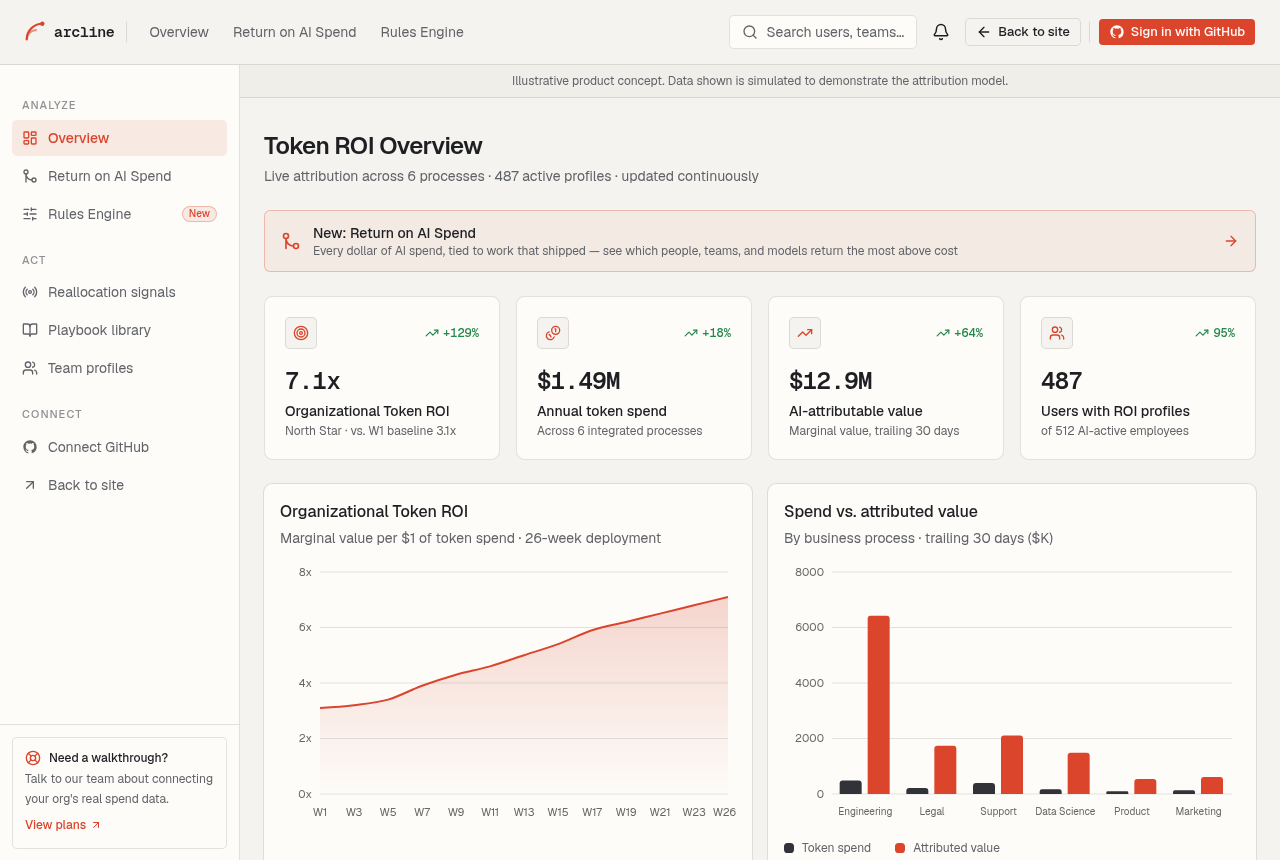
Diagnose
Find where the money leaked, ranked by what a fix returns.
A grade scored on the share of metered spend a remedy would actually recover — never an arbitrary deduction. Each finding expands to its evidence, its remedy, and the dollars it reclaims.
Open this view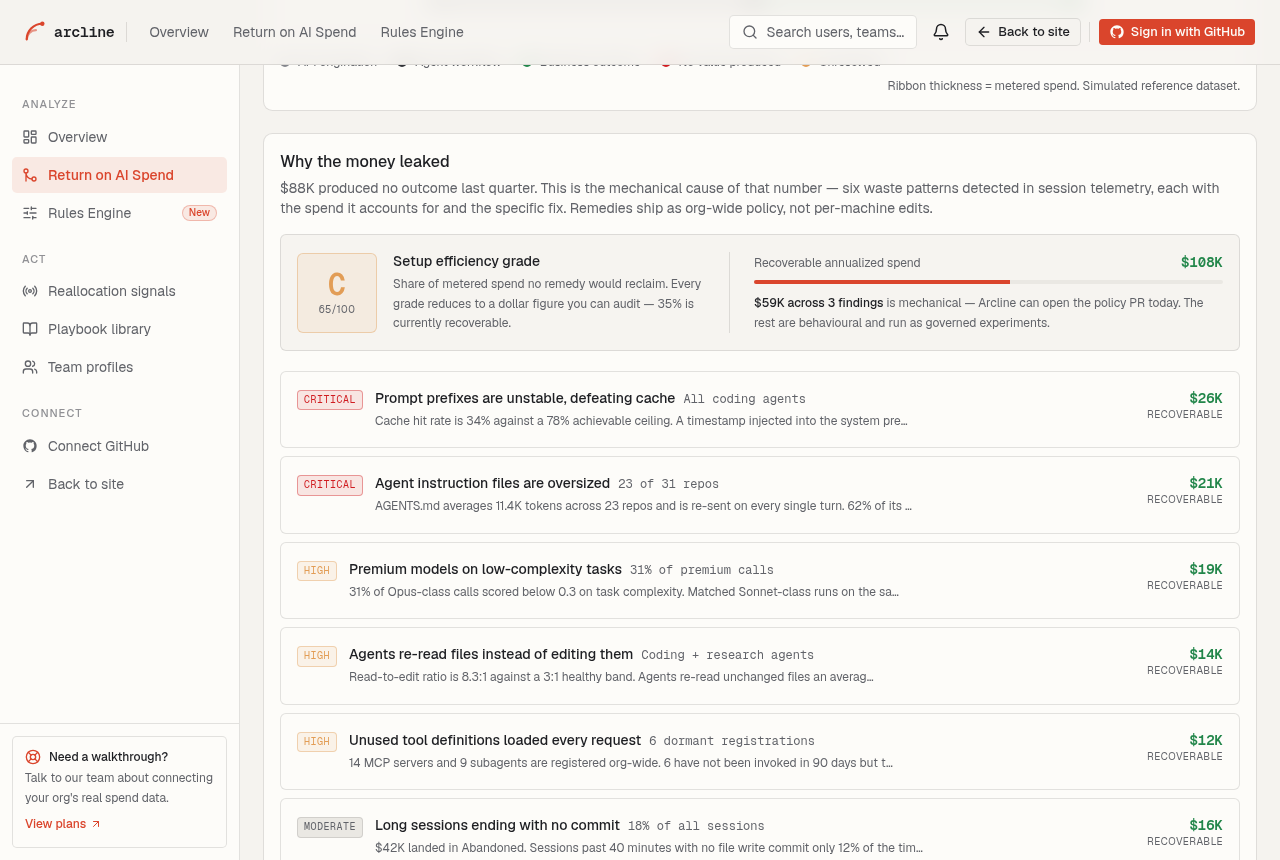
Act
Change the policy, then prove what the change caused.
Routing and budget rules run as governed experiments against a holdout, so a saving is measured against a counterfactual instead of a hopeful before-and-after. This is the layer free metering tools cannot reach.
Open this view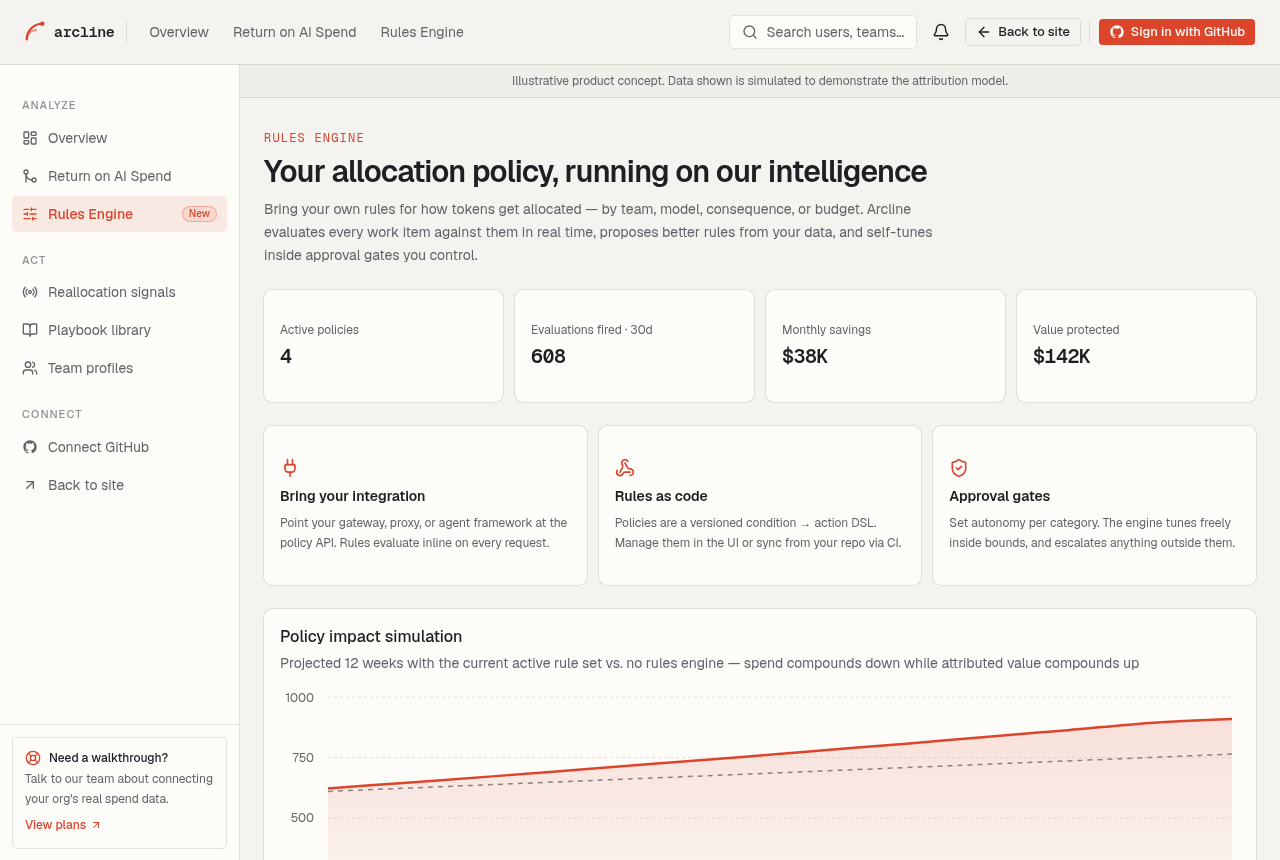
· Post-training ·
Your way of working, compiled into a model.
This is where Arcline stops being a dashboard. The outcome record becomes specialist weights — trained on your work, kept current, and owned by you.
01
Your team works exactly as it does today
Cursor, Claude Code, Copilot, internal agents — whatever harness you already run. Arcline observes through provider and gateway connectors. Nothing changes in your engineers' loop.
Your harness, untouched
02
Every task gets an outcome label
Sessions resolve to shipped, rejected, or unresolved against merges, tickets, and deploys. The trajectory that produced the merge is stored with the evidence that it worked.
Verified, not self-reported
03
The corpus gets assembled for you
Winning trajectories from your top decile become preferred examples; abandoned paths become negatives. Export it as JSONL into your own trainer, or let us run the post-training job.
Yours to export
04
The model comes back specialized
Post-trained on how your company actually ships. Fewer retries, less prompt scaffolding, and the same task completing in a fraction of the tokens.
Weights you own
Then it runs again. Every merge and ticket adds signal, so the next checkpoint is trained on a sharper corpus than the last. The advantage compounds instead of depreciating.
Bring your own harness and your own trainer. We are the data layer, not a walled garden. Corpora export clean and the weights are yours — including on the way out.
Your best engineers' method becomes everyone's default. The top decile's approach stops being tribal knowledge in one person's head and starts arriving inside the model the whole team uses.
The model never goes stale. Your codebase, product, and team change every quarter. Continuous refresh on live outcomes keeps the weights current instead of frozen at the last training run.
· Where we sit ·
Post-training has no source of verified outcomes. We are it.
Trainers and RL environments are becoming commodity infrastructure. The scarce input is data that knows which work actually succeeded — and that only exists where spend meets attributed business results.
Base + open-source models
Llama, DeepSeek, Qwen, in-house foundation models
Raw capability. General weights with no knowledge of any one company's tasks.
Post-training infrastructure
Prime Intellect, River AI, RL environment and trainer stacks
Turns data into specialist weights — trainers, RL environments, compute at scale.
Starves without verified reward signal. It can train on anything, but only outcome-labeled data makes the weights better at the business task.
Verified-outcome dataArcline
The layer only a visibility platform can occupy
Arcline meters every token across real business workflows and attributes it to a shipped, rejected, or unresolved outcome — producing the outcome-verified corpora post-training runs on.
Businesses running AI
Every company spending on agents and copilots
Where tokens are spent and outcomes actually happen — the ground truth everything above depends on.
We do not compete with the trainers. We supply them.
Security & Compliance
Built for procurement, not just for demos
Arcline sits in the path of your most sensitive signal — token usage tied to people and output. The trust layer is designed in from day one.
Security-first architecture
Built from day one for a SOC 2 Type II audit. Compliance roadmap available on request.
Encryption everywhere
TLS 1.3 in transit, AES-256 at rest. Token telemetry is content-free — we never store prompt or completion text.
Enterprise identity roadmap
SAML 2.0 / OIDC SSO, SCIM provisioning, and team-level role controls are on the enterprise roadmap.
Privacy by architecture
Per-user telemetry is designed for pseudonymization and configurable retention. EU data residency is on the enterprise roadmap.
Procurement roadmap
DPA, SCC, and transparent subprocessor documentation are planned for enterprise readiness.
Deployment isolation roadmap
Dedicated infrastructure and VPC peering are planned options for regulated enterprise deployments.
North star metric
Increase your organizational Token ROI by 2x within 12 months.
The single metric Arcline optimizes for is total marginal value generated per dollar of token spend across every integrated process. See it in the live demo dashboard.
The Fair Measurement Standard
Attribution without trust is surveillance. Every deployment starts here.
- You see your data first. Every individual sees their profile before any manager does.
- Content-free by design. We measure metadata — never prompts or completions.
- Expansion, not extraction. Signals default to where the company should invest more.
- Confidence-honest. Low-confidence attribution is labeled, never laundered into a leaderboard.